Edge Software

Iotistica Agent

The Iotistica Agent is a lightweight edge platform that runs on virtually any Linux-based gateway. It securely collects data from local equipment, processes and enriches it at the edge, and continues operating even without cloud connectivity. Built-in anomaly detection, trend analysis, forecasting, schema drift detection and data-quality validation reduce bandwidth, lower cloud AI costs, and provide cleaner, context-rich data for analytics and machine learning. Processed data can be published to MQTT brokers or, with Pro, directly to InfluxDB, Azure IoT Hub, AWS IoT Core, and Google Cloud.

Offline-First by Design

Every reading is buffered locally, so the agent keeps collecting and processing data through network outages or cloud downtime, then syncs automatically the moment connectivity returns — no data loss, no manual recovery.

On-Device Anomaly Detection

Statistical models running at the edge flag abnormal equipment behavior in real time, without waiting on a round trip to the cloud — cutting bandwidth and downstream AI costs while surfacing problems sooner.

Schema Drift Detection

Automatically learns each device's expected data shape and flags it the moment a point disappears, changes type, or a device's configuration shifts — catching a failing or misconfigured device before bad data reaches your pipeline.

Industrial Protocol Bridging

Native support for Modbus TCP/RTU, OPC UA, BACnet, and MQTT — connect directly to the equipment you already have on the floor, no separate gateway hardware required.

Container Orchestration

Deploy and manage Docker containers alongside data collection, so edge applications and protocol adapters run and update together on the same device.

Flexible Cloud Publishing

Publish to any MQTT broker out of the box, or connect directly to InfluxDB, Azure IoT Hub, AWS IoT Core, and Google Cloud with Pro — your data platform, your choice.
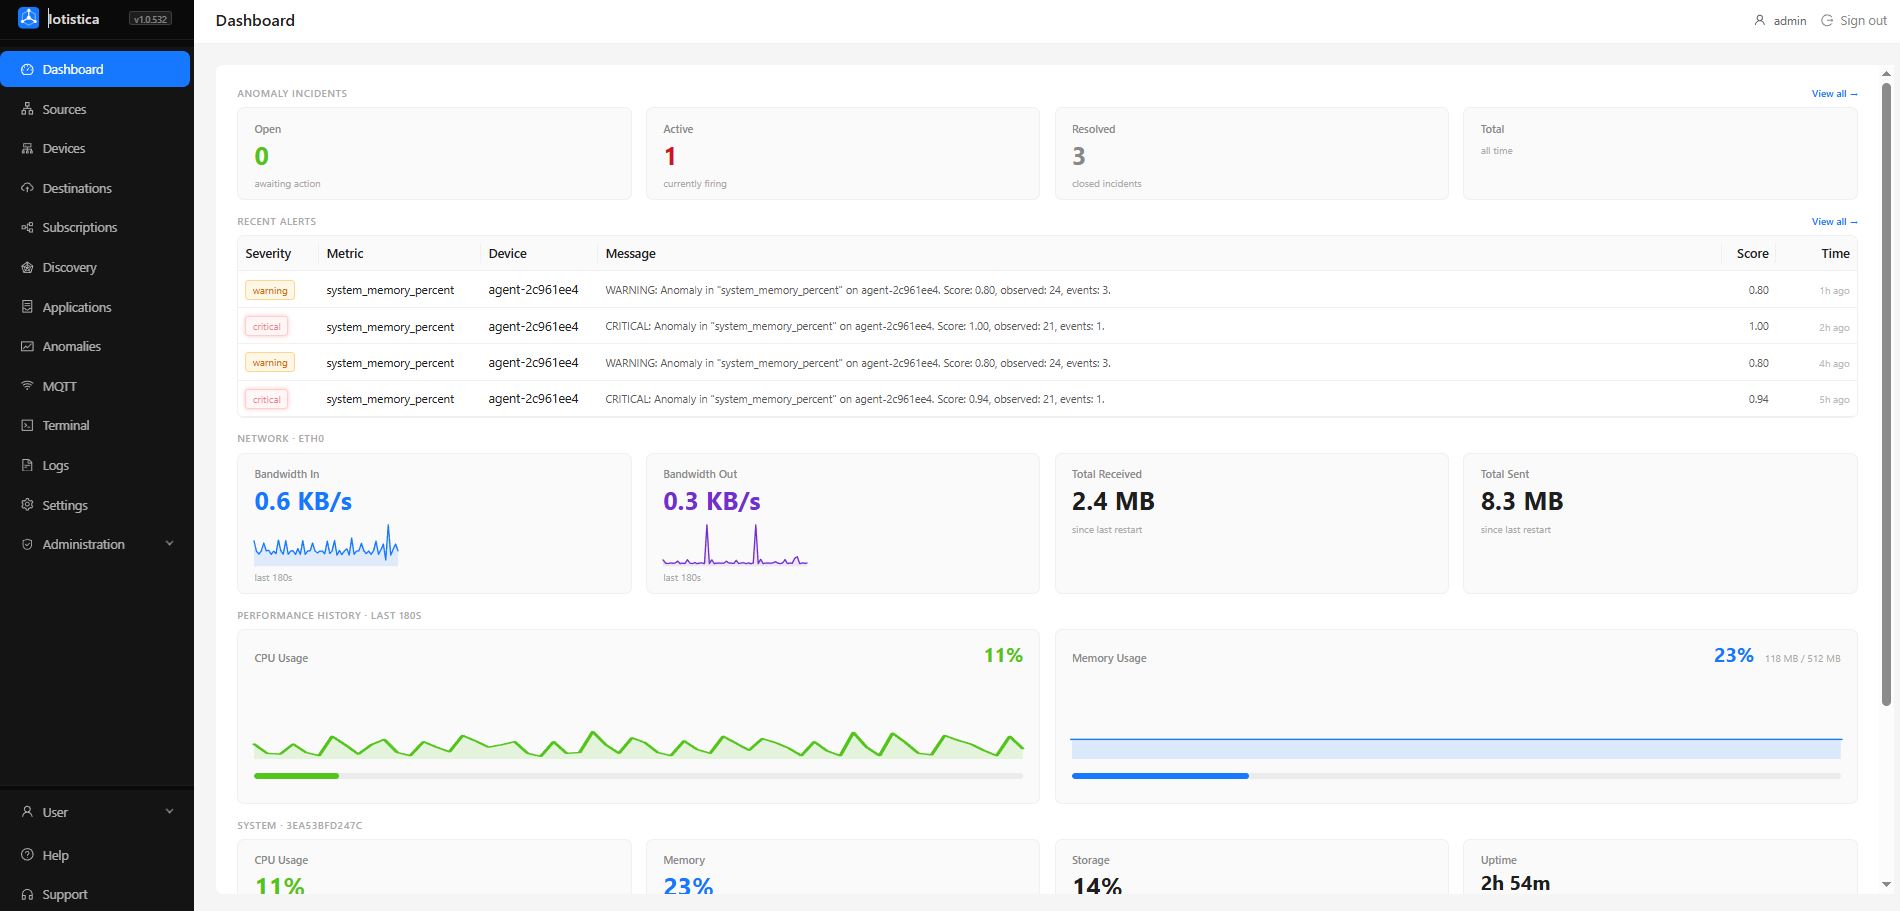
Iotistica Agent dashboard showing device telemetry, sources, and anomaly detection

Community

Agent Community is a free, self-hosted edge runtime for developers, system integrators, and organizations building industrial IoT solutions. Deploy without creating an account, operate entirely offline, or connect to the MQTT broker or data platform of your choice.

  • Supports Modbus TCP/RTU, OPC UA, BACnet, and MQTT
  • Integrated web-based administration
  • Publish telemetry to any MQTT broker in Tag/Value or ECP formats
  • Data buffering
  • Cross-platform support
  • Docker container orchestration/li>
  • REST API
View on GitHub

Pro

Everything in Agent Community, plus on-device anomaly and schema drift detection, scheduled device discovery, and flexible publishing to the data platform of your choice.

Everything in Community, plus:

  • Device discovery
  • Anomaly detection
  • Schema drift detection
  • Publish to cloud
  • MQTT broker monitor
  • 24/7 Technical Support
Get in Touch Try Live Demo
Cloud Infrastructure

Managed Cloud Ingestion

For Agent Pro customers who'd rather not run their own MQTT broker or time-series database, we provision a managed ingestion backend on request — sized to your fleet rather than sold as a fixed tier. Reach out and we'll set up a hosted broker, ingestion pipeline, and time-series storage for your deployment.

Once provisioned, Iotistica Agent Pro devices connect securely and begin publishing data immediately with zero infrastructure setup on your end. Your applications can access telemetry, historical data, and device metrics through a simple, well-documented API.

For organizations that require complete control over their infrastructure or need to meet internal compliance requirements, the same platform is also available as a self-hosted deployment that can be installed on your own servers or cloud environment.

Hosted MQTT Broker

A managed broker with per-device authentication and topic-level access control. Agents authenticate on connection; each device is isolated to its own namespace.

Telemetry Ingestion

A high-throughput ingestion pipeline processes incoming readings in real time. Built for sustained load with no data loss, even during traffic spikes.

Time-Series Storage

Readings are stored in a compressed time-series database with pre-built aggregates for hourly and daily rollups. Raw data retained up to two years.

REST API

Query telemetry, retrieve device status, manage fleet configuration, and access anomaly data — all through a single REST API your team can build against.

Fleet Management

Push configuration changes, monitor device health, dispatch jobs, and access devices remotely through the same platform your agents connect to.

Self-Hosted Option

Deploy the full ingestion stack on your own infrastructure — on-premise, private cloud, or air-gapped environments. Docker Compose and Kubernetes deployments supported.

Developer Tools

Industrial SimulatorsNew

Browser-based simulators that replicate the behaviour of real industrial devices — no hardware, no wiring, no configuration files. Each simulator speaks the native protocol over the network, so any standard client, gateway, or agent sees it as an actual device and can read, write, and subscribe to it in the same way it would on a production floor.

Simulated objects support configurable behaviour patterns including sinusoidal cycles, random walk, scheduled setpoint changes, ramps, and fault injection — making it straightforward to reproduce edge cases, stress-test anomaly detection logic, or demonstrate integrations without access to physical equipment.

BACnet/IP Simulator

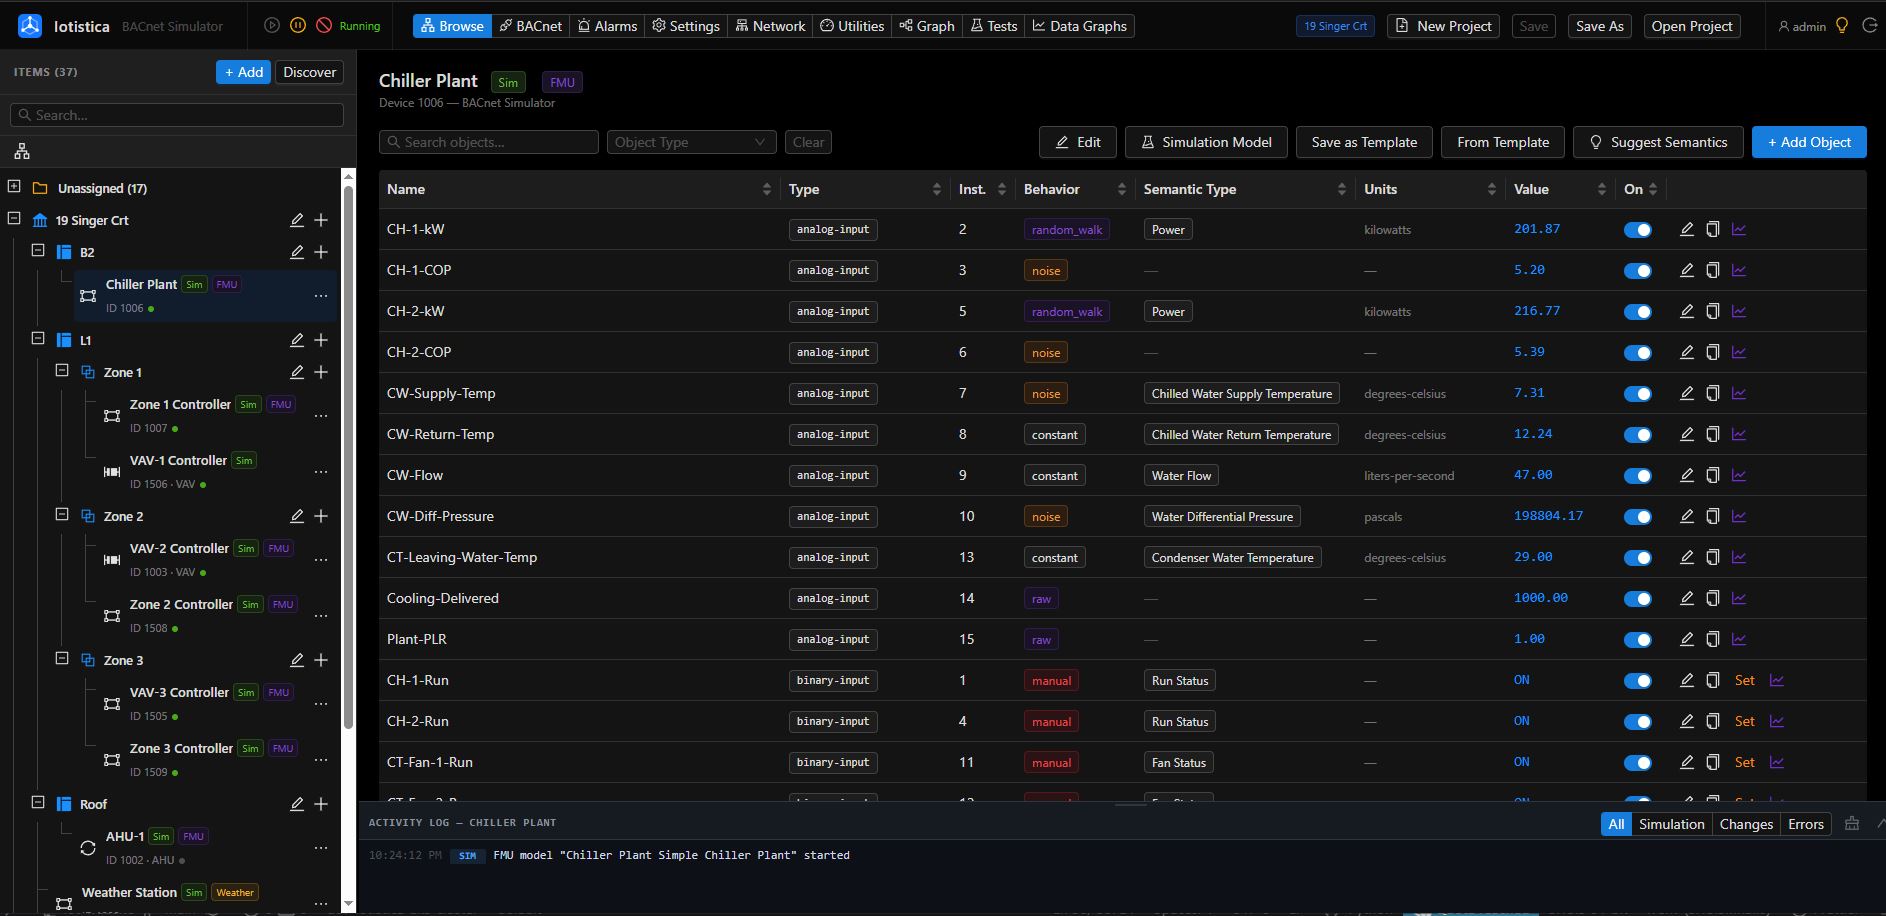
A full BACnet/IP device stack in the browser, with HVAC-focused equipment templates. Spin up an entire building in minutes — air handlers, VAV boxes, chiller and boiler plants, lighting gateways — and read, write, and monitor every point exactly as you would against real equipment on the network. No hardware, no wiring, no field visit required to build a realistic test bed.

Browser-based BACnet simulator showing configured devices, live object values, and Brick Schema point tags

Real Protocol Stack

WhoIs, ReadProperty, and WriteProperty over standard BACnet/IP UDP — indistinguishable from a physical device to any client on the network.

HVAC Equipment Templates

Pre-built AHU, VAV, FCU, chiller, and boiler templates create a full set of realistic objects with sensible names and units in one click.

Behaviour Engine

Sine waves, random walk, occupancy schedules, and linear ramps on every object — combine them to model real-world equipment cycles.

Fault Injection

Spikes, stuck values, and offline dropouts at a configurable MTBF, for testing alarm escalation and anomaly detection logic.

Save/Reload Projects

Save an entire device topology as a named project and reload it instantly for repeatable test environments.

Brick Schema Point TaggingNew

Tag devices and points with a standardized Brick Schema type, so instead of guessing what "AHU-1.SF-Run" means, your data speaks in recognizable terms like AHU and Run Status right in the objects table.

Analytics Dashboard

A live operations view of the whole simulated network — traffic, alarms, and per-device activity, updating in real time as clients read and write against your devices.

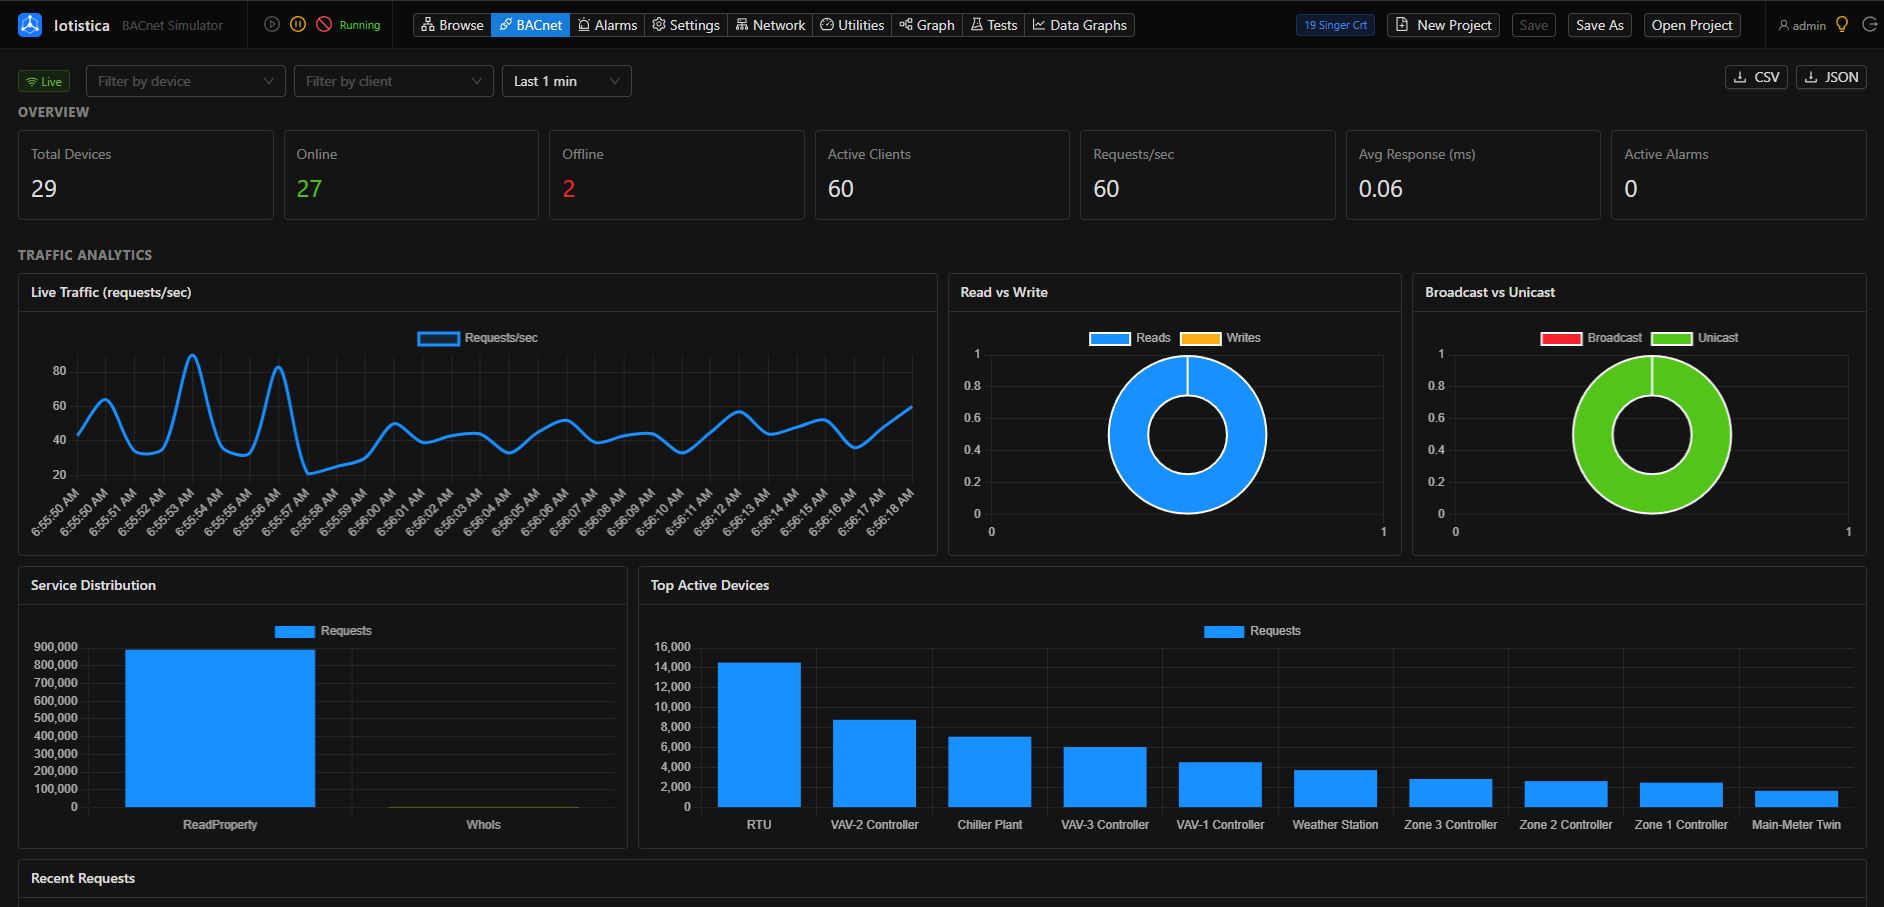
BACnet simulator analytics dashboard showing live traffic, read/write and broadcast/unicast breakdowns, and top active devices

Live Traffic Monitoring

A real-time requests-per-second graph shows exactly how a client or gateway is polling the network as it happens.

Read/Write & Broadcast/Unicast Split

Visual breakdowns by service type and delivery method — a quick way to validate how a client is actually talking BACnet.

Top Active Devices

See which devices are generating the most traffic, so a misbehaving poller or a hot device stands out before it becomes a problem.

Network Overview at a Glance

Total, online, and offline devices, active clients, average response time, and active alarms — all summarized in one row.

Filter by Device or Client

Narrow the entire dashboard down to a single device or connecting client to debug one integration at a time.

CSV/JSON & EDE Import/Export

Pull the underlying analytics data out for your own reporting, or to attach to a bug report. Devices and objects also import and export as BACnet EDE files, so you can bring in a real project's point list instead of building one by hand.

OPC UA Simulator

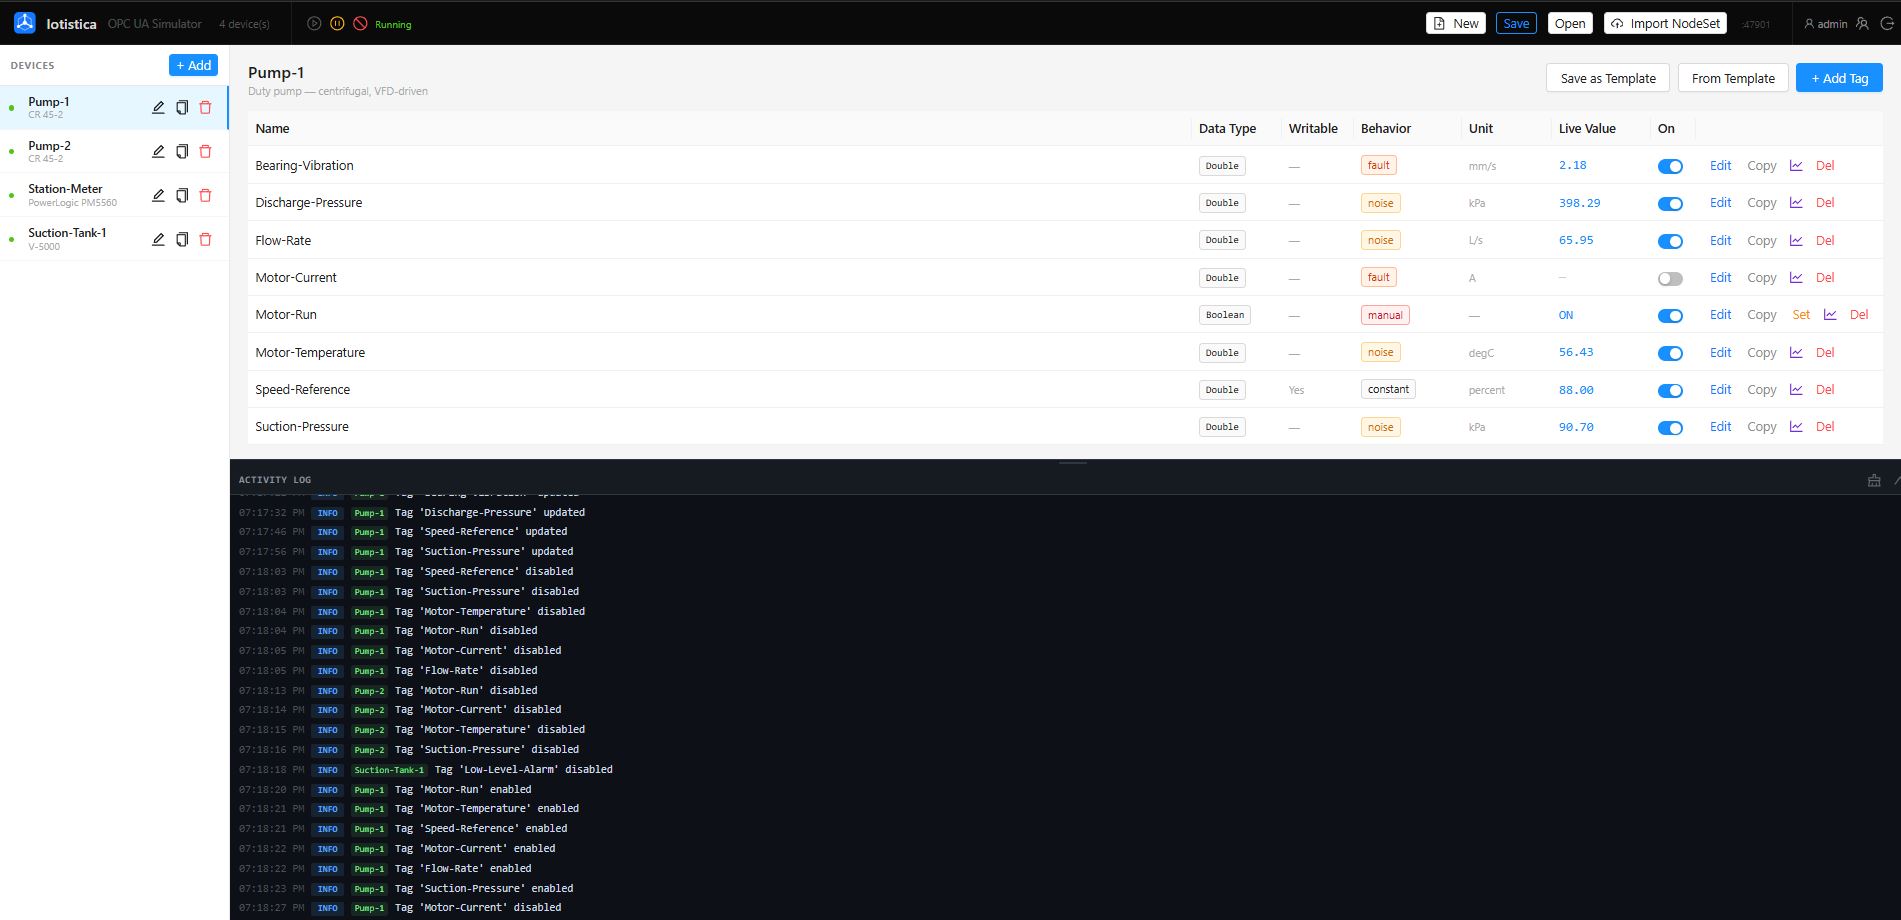
A real OPC UA server with a Device → Tag address space, importable from real vendor files.

Browser-based OPC UA simulator showing configured devices and live tag values

Real OPC UA Server

Any standard client can browse, read, write, and subscribe over opc.tcp — the same as it would against a production PLC.

NodeSet2 XML Import

Load a real vendor's address space export instead of building one by hand, and assign simulation behaviour to the imported tags.

Behaviour Engine

The same sine, random walk, ramp, and fault-injection engine as the BACnet simulator, configurable per tag.

Industrial Presets

Ready-to-run profiles with realistic equipment, tags, and fault behaviour already configured.

Save/Reload Profiles

Save an entire device topology as a named profile and reload it instantly for repeatable test environments.

At a Glance

Which offering fits your project?

Start with Agent Community for free — no account required, runs fully offline. Upgrade to Agent Pro when you need fleet management, remote access, or anomaly detection. Need managed ingestion instead of running your own MQTT broker and time-series database? That's available on request — get in touch and we'll scope it for your fleet.

Capability Community Agent Pro
Industrial protocol data collection Yes Yes
Local admin UI and device API Yes Yes
Publish to any MQTT broker Yes Yes
Offline buffering Yes Yes
Local device discovery Yes
Publish to InfluxDB, Azure, AWS, GCP Yes
Zero-touch provisioning Yes
Fleet management and desired-state config Yes
Secure remote shell Yes
Fleet job dispatch Yes
On-device anomaly detection Yes
Open source Yes

Ready to get started?

Install the agent on any Linux device in under two minutes, or reach out to discuss fleet management and cloud ingestion for your project.